
Likert Scale Examples, Templates, and Response Options for Surveys
Let’s start with an interesting fact I learned while writing this blog post. As I kept typing, the autocorrect suggested I capitalize the “L” of Likert scale.
This got me curious, and I discovered it was because this crucial survey tool is actually named after the scale’s inventor, Rensis Likert, a social psychologist who wanted to come up with an effective way to measure people’s opinions.
Since then, knowing whether your users like your brand hasn’t been enough anymore. You need to know how much or how little they like it. That’s where a Likert scale’s specialty lies. It brings you the measurement of your users’ satisfaction, opinion, experience, and whatnot.
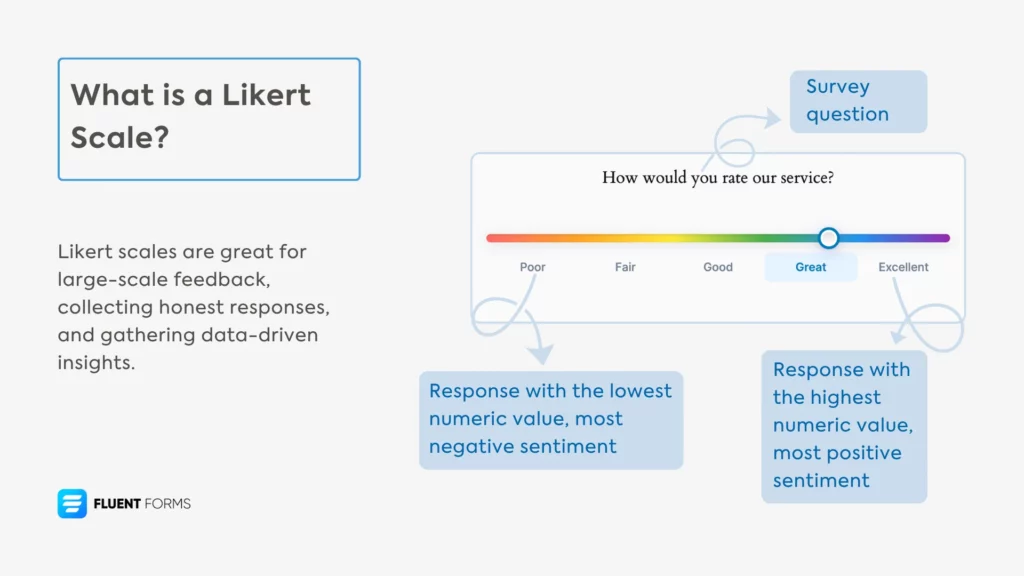
A Likert scale is a rating scale used in surveys to measure opinions, attitudes, or experiences. It offers a range of answer options from one extreme (e.g., “Strongly Agree”) to another (e.g., “Strongly Disagree”), often with a neutral midpoint.
This article provides a comprehensive guide with examples, templates, response options, and instructions on how to create and analyze Likert scales. Let’s dive right in.
What’s a Likert scale
A Likert scale is a rating scale used to measure survey participants’ opinions, attitudes, motivations, etc. The most common format is a 5-point scale, but scales can range from 2 points to 7 points or more.
Ideally, the responses are broken down into granular options. Instead of binary choices like like/dislike, there are more flexible options that range between two extremes (e.g., extremely like to extremely dislike), often including a neutral or “not sure” option.
This makes it easy for participants to provide accurate answers to questions they couldn’t answer with a simple good/bad. For example, they might feel an experience was better than good or below average, but not entirely bad. This is where a Likert scale with a wider range of options proves to be helpful.
Moreover, Likert scales come in handy for large-scale feedback, since the result is a mathematical calculation, and you don’t have to rely on text inputs for insight.
Once you get used to Likert scales, you’ll find that you’re taking more data-driven decisions, leading to fewer errors in your strategies. The best part is, you can tailor your Likert scale response options to fit any survey question of varying nature.
Likert scales are a method for collecting quantitative data about qualitative concepts. While the attitudes and opinions being measured are qualitative, they are converted into numerical data that can be analyzed statistically.
Likert scale examples with response options
Likert scales are categorized by the number of response options they offer. Below are common examples for different point scales, categorized by the type of measurement.
2-Point Likert Scale Examples (Dichotomous)
| Agree Disagree | True False | Yes No |
3-Point Likert Scale Examples
| Opinion: More than I would like About right Less than I would like | Quantity: Too much About right Too little | Likelihood: Extremely Moderately Not at all |
4-Point Likert Scale Examples (No Neutral Option)
| Frequency: Most of the time Some of the time Seldom Never | Agreement: Strongly Agree Agree Disagree Strongly Disagree | Probability: Definitely won’t Probably won’t Probably will Definitely will |
A 4-point scale is a “forced choice” scale because it removes the neutral option, requiring respondents to lean towards a positive or negative response.
5-Point Likert Scale Examples (Most Common)
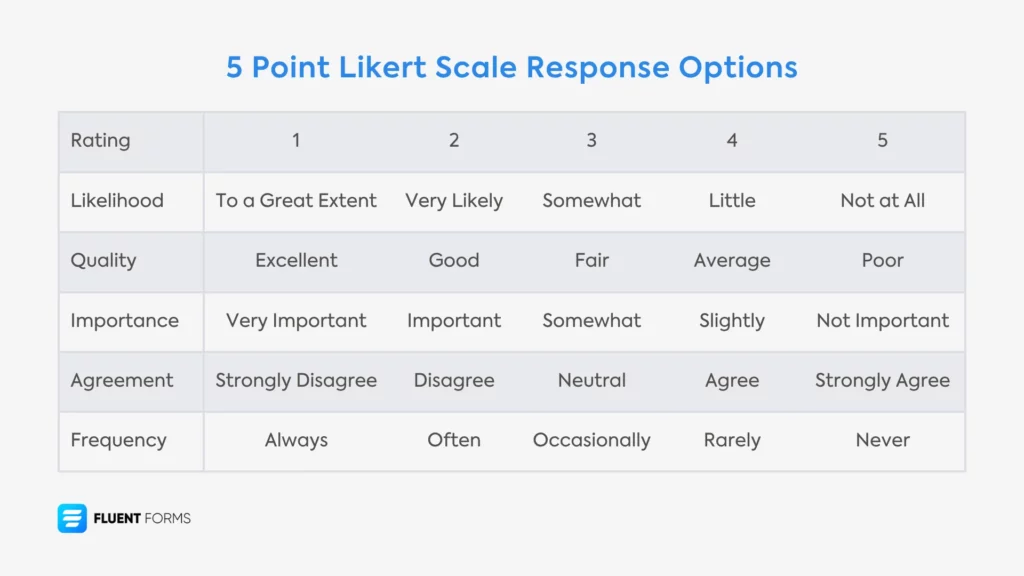
| Comparison: Much better Somewhat better Stayed the same Somewhat worse Much worse | Opinion: Strongly Agree Agree Undecided Disagree Strongly Disagree | Rating: Very High Above Average Average Below Average Very Low |
| Quality: Excellent Above Average Average Below Average Very Poor | Quality: Very good Good Fair Poor Very poor | Likelihood: Extremely Very Moderately Slightly Not at all |
| Frequency: Almost always Often Sometimes Seldom Never | Satisfaction: Very satisfied Satisfied Neither Dissatisfied Very dissatisfied | Importance: Very important Important Fairly important Slightly important Not important |
6-Point Likert Scale Examples
| Opinion: Completely Agree Mostly Agree Slightly Agree Slightly Disagree Mostly Disagree Completely Disagree | Frequency: Always Very Frequently Occasionally Rarely Seldom Never | Quality: Poor Fair Good Very Good Excellent Exceptional |
7-Point Likert Scale Examples
| Likelihood: Almost Always True Usually True Often True Occasionally True Rarely True Seldom True Never True | Quality: Far Below Moderately Below Slightly Below Met Expectations Slightly Above Moderately Above Far Above | Satisfaction: Very Dissatisfied Moderately Dissatisfied Slightly Dissatisfied Neutral Slightly Satisfied Moderately Satisfied Very Satisfied |
Besides these, you can ask users to express their opinion through a numerical range (e.g., 1-10), where the highest number represents the most positive sentiment and the lowest represents the most negative.
How to analyze Likert scale data
To analyze results, you assign a numerical value to each response option. You can then calculate the mean (average) score to get a basic rating.
For example, let’s assign values to a 5-point rating scale:
| Q. How would you rate us? Option A: High = 5 Option B: Above Average = 4 Option C: Average = 3 Option D: Below Average = 2 Option E: Low = 1 |
The formula for the mean score is:
(Total score for all responses) / (Total number of respondents)
To get the total score, you would use this calculation:
(Number of ‘5’ ratings * 5) + (Number of ‘4’ ratings * 4) + (Number of ‘3’ ratings * 3) + (Number of ‘2’ ratings * 2) + (Number of ‘1’ ratings * 1)
(Interactive Element: A calculator is embedded here to calculate star ratings and percentage distribution based on user input.)
Now that you see the power of a Likert scale, let’s see how to create one.
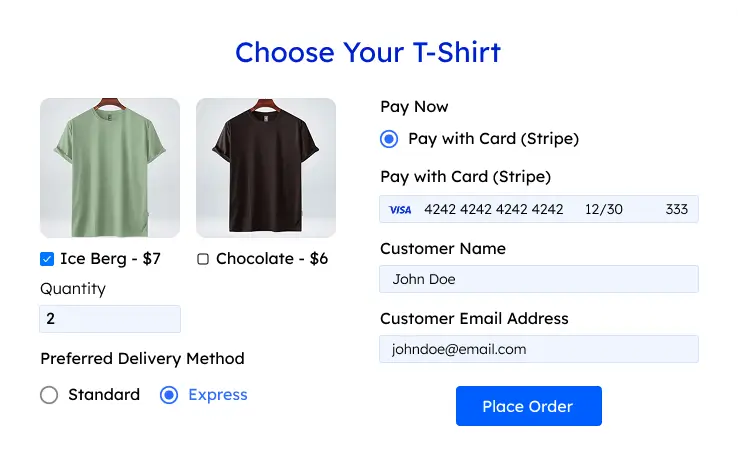
How to create a Likert scale on WordPress (with Fluent Forms)
Here’s a step-by-step guide to creating a Likert scale form from scratch in your WordPress dashboard.
1. Install Fluent Forms: Go to your WordPress dashboard and install the Fluent Forms plugin if you haven’t already.
2. Create a New Form: Navigate to Fluent Forms > New Form and choose to create a form from scratch.
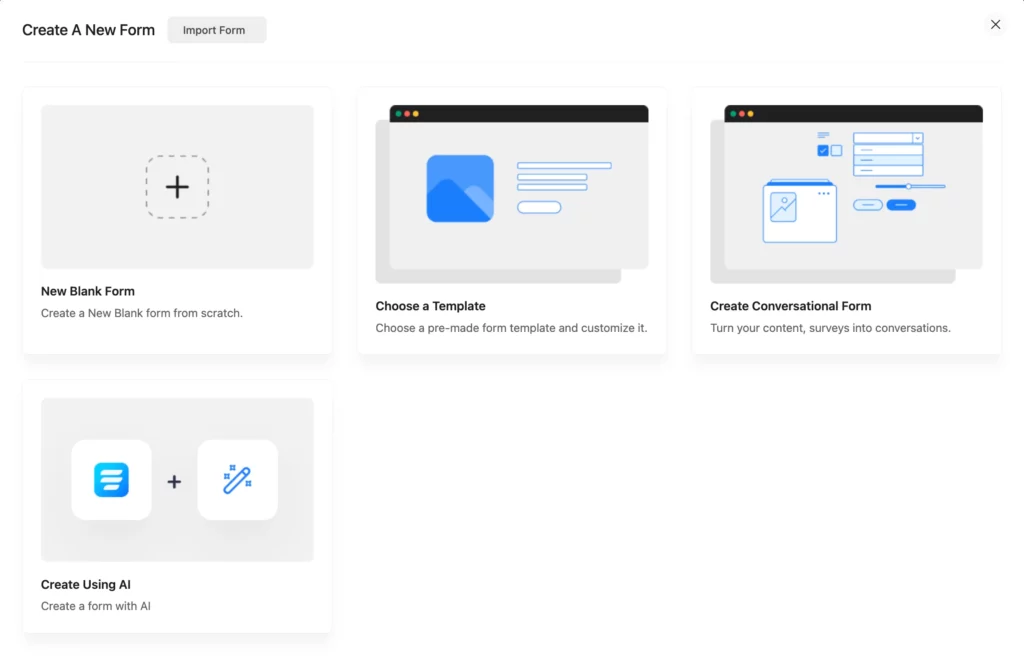
3. Add Contact Fields: Add necessary fields to collect respondent information, such as Name and Email.
4. Add a Likert Scale Field: For the Likert scale questions, you can use several field types:
- Radio Field
- Star Rating Field
- Range Slider Field
- Checkable Grid Field
- Net Promoter Score (NPS) Field
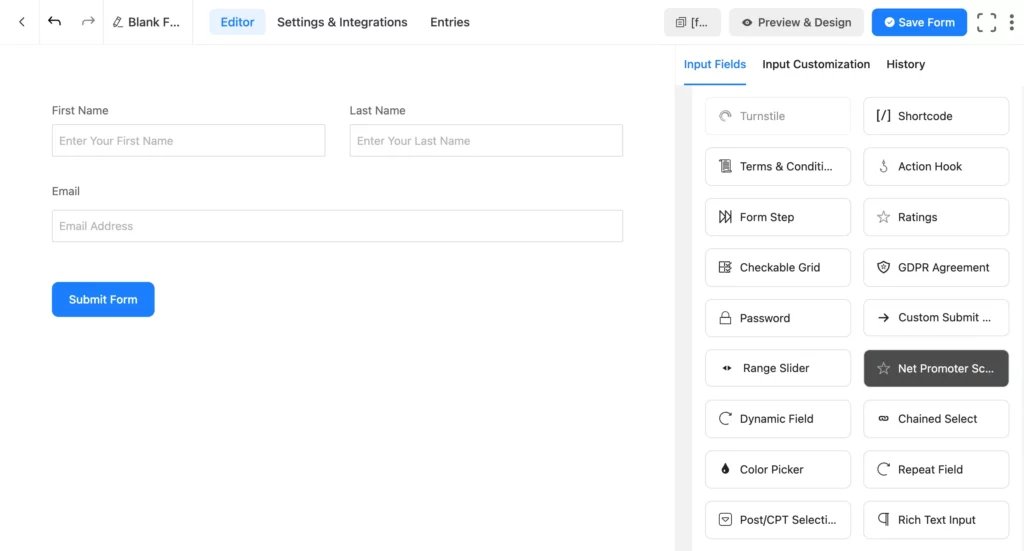
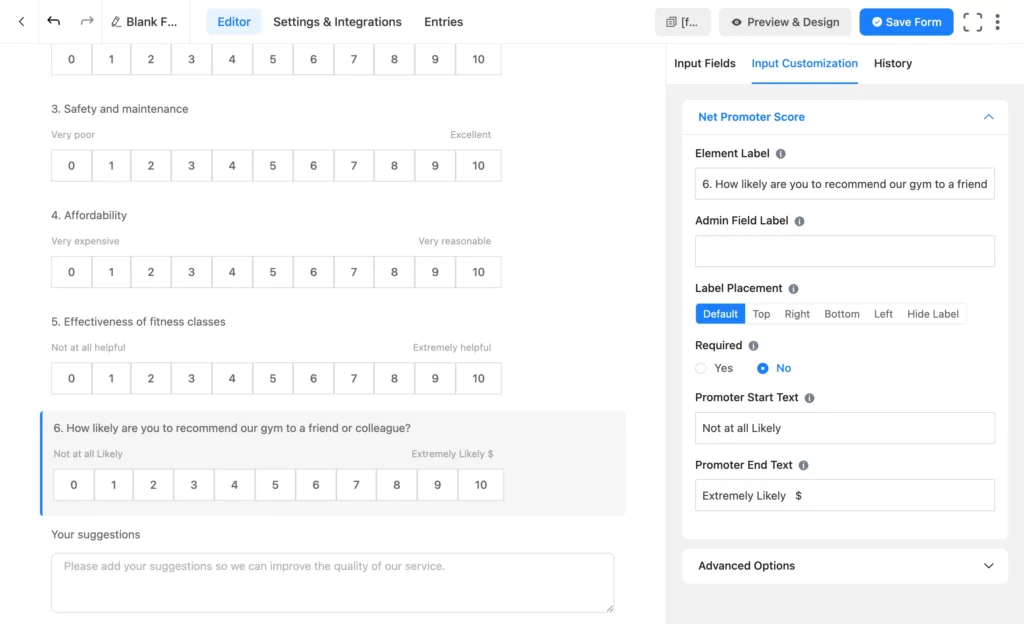
5. Configure the Field: We’ll use the Net Promoter Score field as an example. Drag the field into your form. Click on it to edit the Element Label (your question) and customize the start and end text (e.g., “Very Poor” to “Excellent”).
6. Repeat for All Questions: Add as many Likert scale fields as you need to cover all your survey questions.
7. Save Your Form: Once you are done customizing, click “Save Form.”
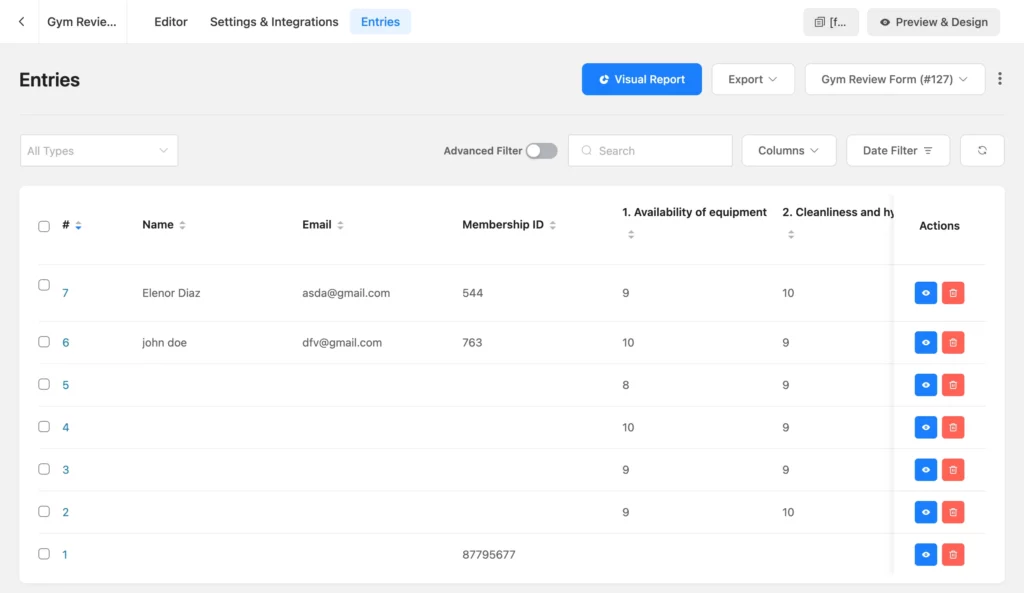
Here’s the form we just created. It’s an example of a gym satisfaction survey created with Likert scale fields.
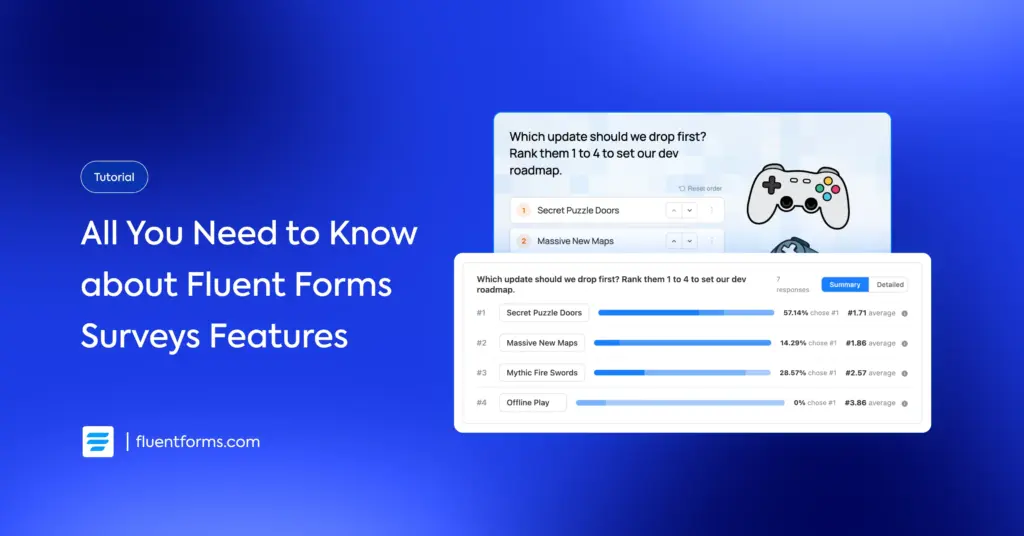
You can click the Entries tab to view the form entries and analytics.
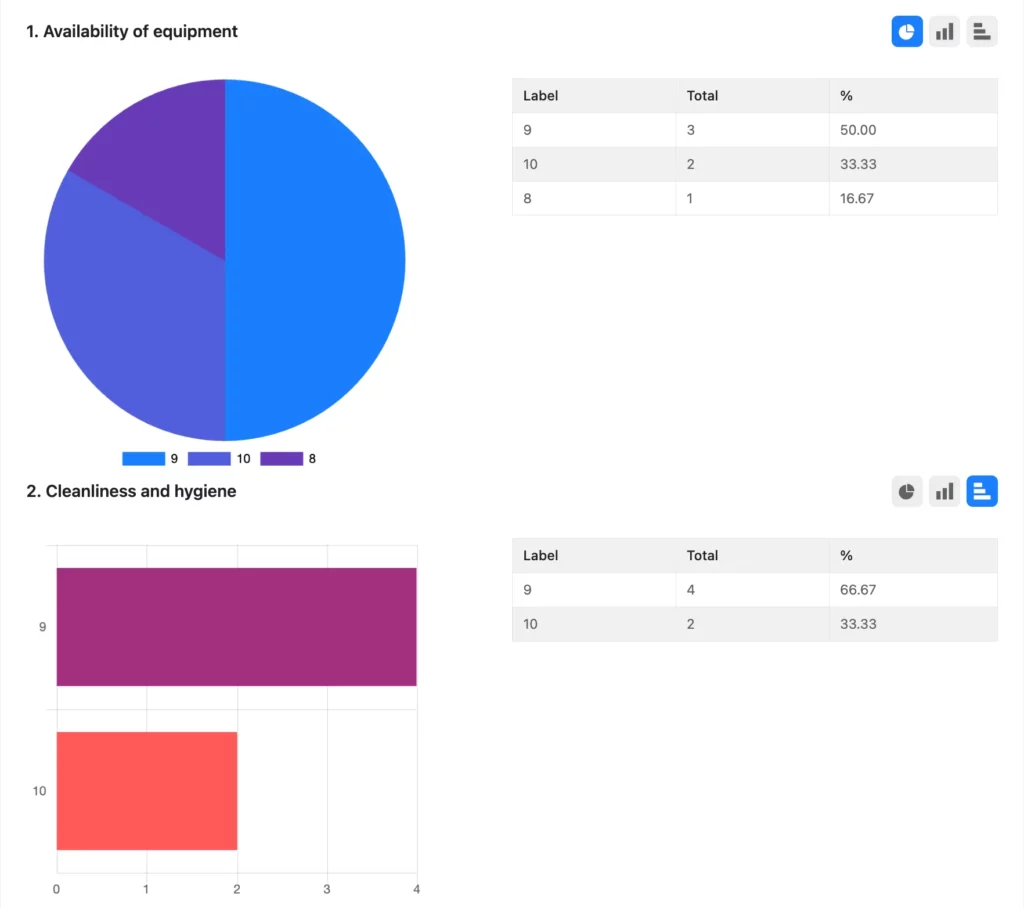
If you click Visual Report, you can see the percentage distribution of answers in various chart formats.
You’ll find the step-by-step guide to creating a Likert scale using the checkable grid field here. If there are any issues, you always know where to knock!
Build Smarter Forms for Free
Likert scale templates
Let’s explore some fun and ready-to-use Likert scale templates. You can download all templates as JSON files via the button below.
Template 1: Event Planner Service Review (5-Point & 3-Point)
This form uses radio fields to create a classic 5-point and 3-point scale, perfect for reviewing a product or service.
Template 2: Dynamic Emoji Star Rating (5-Point)
This simple template uses a star-rating field where the emoji changes based on the score.
You can embed this short, sweet form anywhere on your website or even as pop-up forms to collect quick feedback. Simply download this form from below, and edit the text to display your brand!
Template 3: Restaurant Review Grid (Checkable Grid)
This template uses a checkable grid, allowing users to rate multiple items (e.g., food, service, ambiance) across the same scale in a compact format.
Template 4: Interactive Service Rating (Range Slider)
This template uses a colorful range slider field, which is a fun and interactive way for users to express their opinion. Besides, the ease of use offers a great user experience.
You can download all the Likert scale templates/forms used in this blog with a single click from the button below. There’s a zip folder with 6 JSON files.
Tell us which of these templates you’d like to use. Once you download them, follow this guide to import the form to your site. Share your fun Likert scale ideas with us, and let’s make great forms together!
What’s next
Likert scales are easy to build, easy to use, and easy to analyze. To sum up, they’re unparalleled if you want an effective and successful way to gather insight from user feedback.
With every brand striving to provide the best customer support, this is your cue to stay ahead of others by integrating a Likert scale into your customer support strategies. In this blog post, we’ve covered what it means, how it’s used, examples, templates, how to create and calculate one, and more.
Simply create a Likert scale from scratch or download and customize a template. The next steps are to wait for responses and gain real insight into your products and services from real users. The much-needed vision and perspective we all deserve!
Let us know if you face any issues setting up the forms or templates, and don’t forget to share your win with us. Happy surveying!

Sarika writes for Fluent Forms and loves to offer insights into small businesses. She’s curious and enjoys discussing ideas, interests, and perspectives. In her free time, she’s either marvelling at architectural beauties or trying different cuisines.


Leave a Reply