The Payments feature provides a comprehensive dashboard to track and analyze all financial transactions processed through your forms. Use these reports to monitor your revenue, view transaction statuses, and understand which forms are generating the most income.
Accessing the Payment Reports #
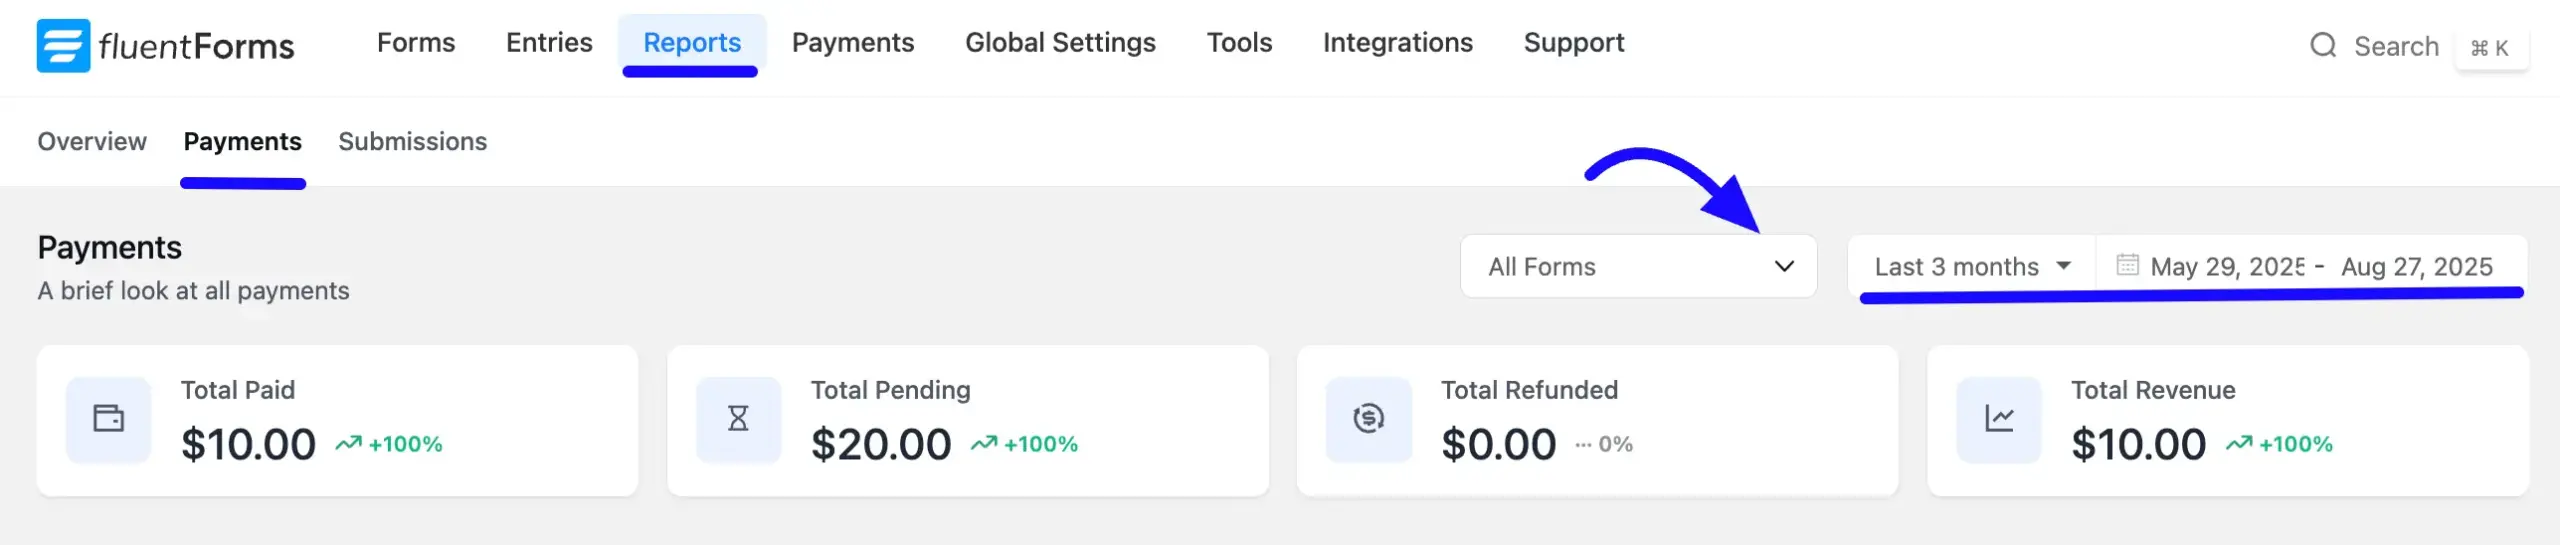
Go to your WordPress dashboard, then navigate to Fluent Forms > Reports in the top menu bar. When you open the Reports screen, you’ll automatically be on the Overview tab. Now, select the Payment option, and you will see all the payment-related reports.
Filtering Payment Data #
Refine the data shown on the entire dashboard using the filters located at the top of the page.
- All Forms: Select this dropdown to view payment data for all forms or select a specific one.
- Date Range: Click this filter to select a time period, such as Last 3 months, or choose a custom date range.
Payments #
The summary cards at the top offer an at-a-glance overview of your financial activity for the selected period.
- Total Paid: The total amount of completed payments.
- Total Pending: The total amount of payments that have been initiated but are not yet complete.
- Total Refunded: The total amount that you have refunded to customers.
- Total Revenue: The net income after accounting for refunds and other adjustments
Analyzing Payment Charts and Tables #
The dashboard includes several sections to help you visualize and understand your payment data in detail.
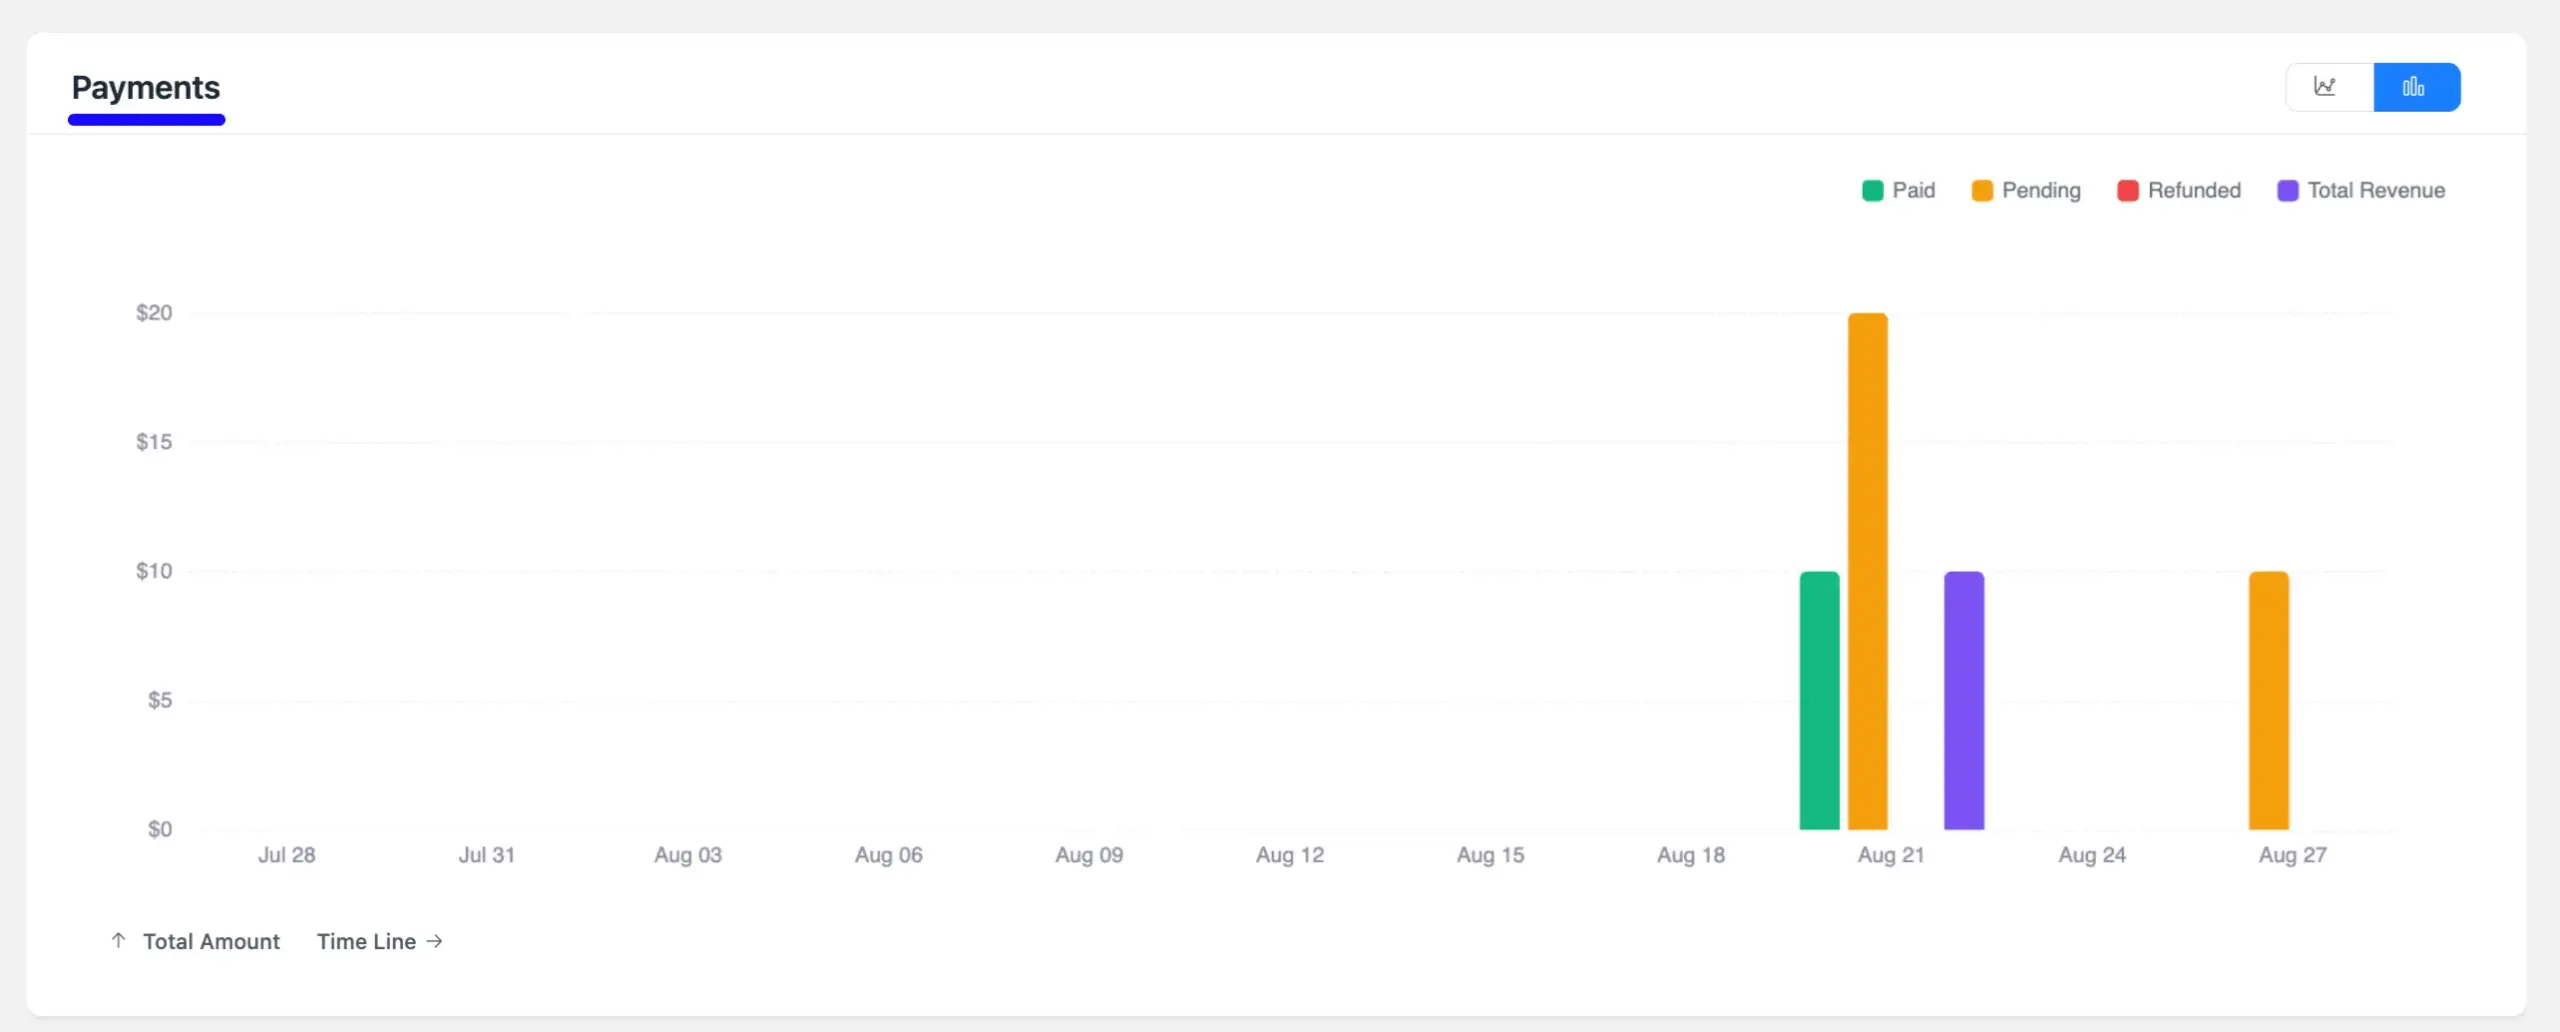
Payments Chart: This bar chart visualizes your payment trends over time. You can use it to compare the amounts for Paid, Pending, Refunded, and Total Revenue statuses on specific dates.
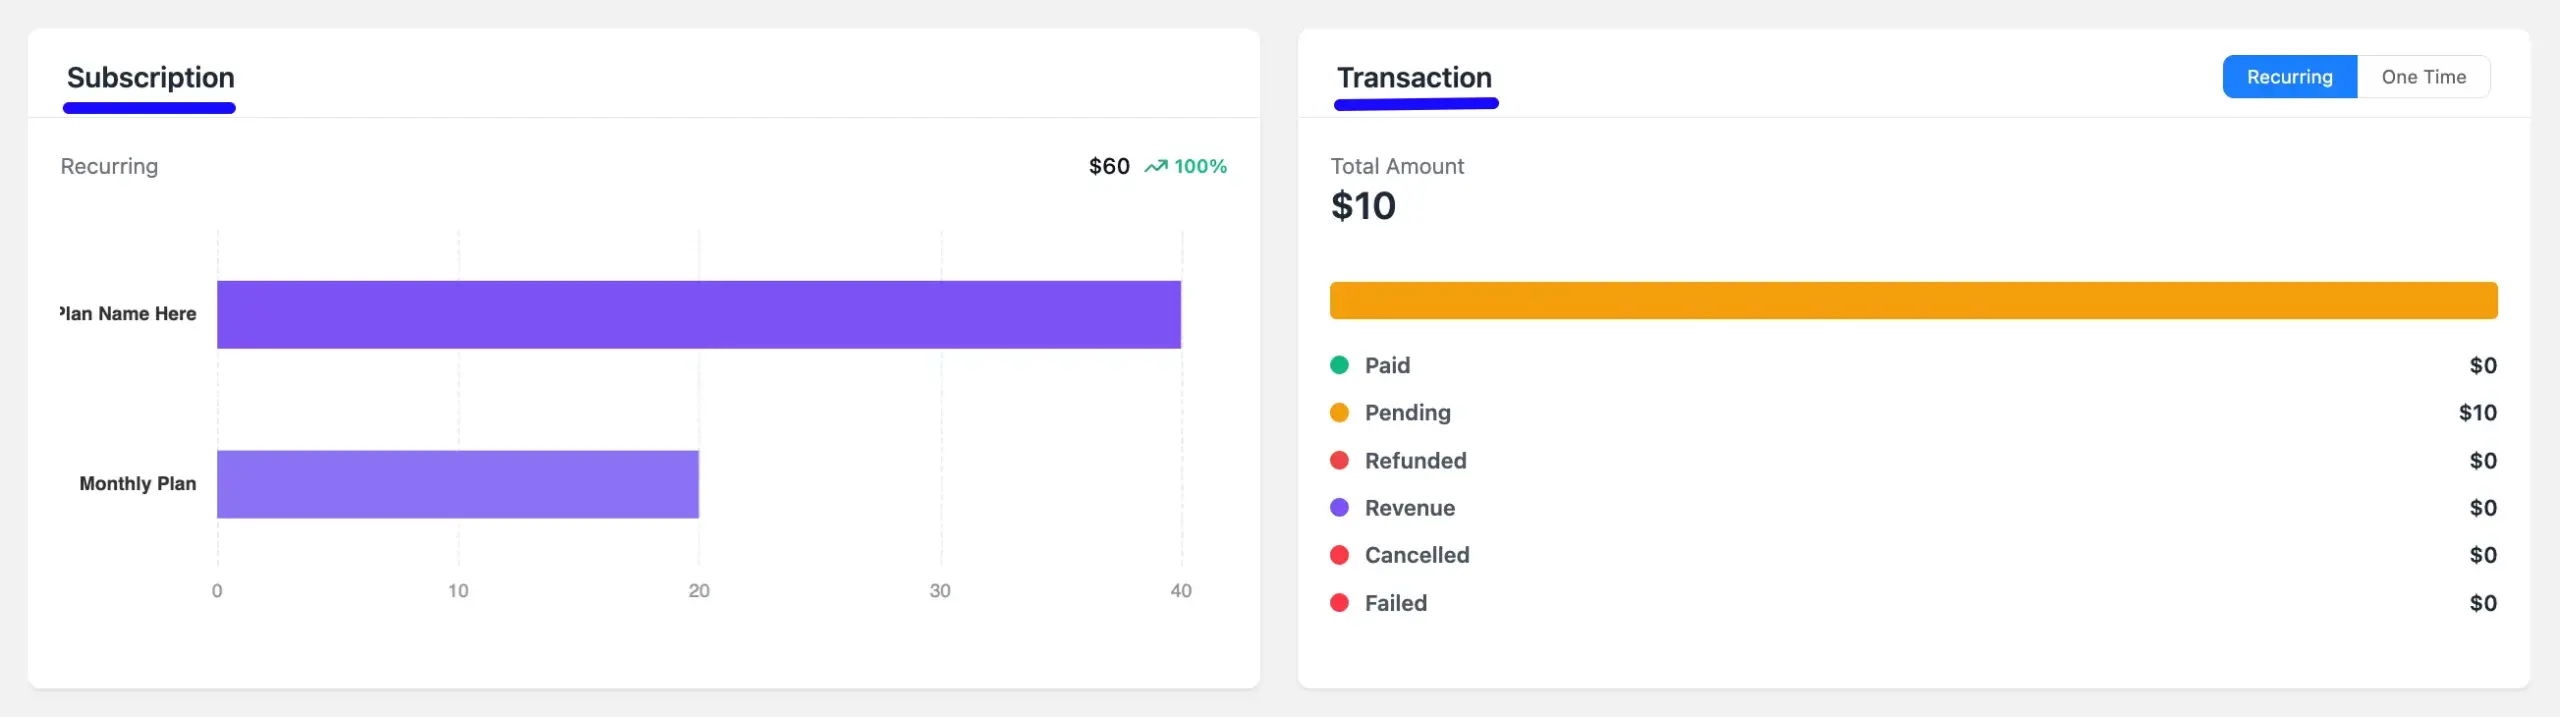
Subscription: The Subscription section is dedicated to tracking recurring subscription data over time. When no subscription payments are found in the selected period, it will show “No subscription data available”.
Transaction Summary: This Transaction chart provides a snapshot of all transactions. You can use the Recurring and One-Time toggles to switch between transaction types. The chart and accompanying list show a breakdown by status, including Paid, Pending, Refunded, Revenue, Cancelled, and Failed.
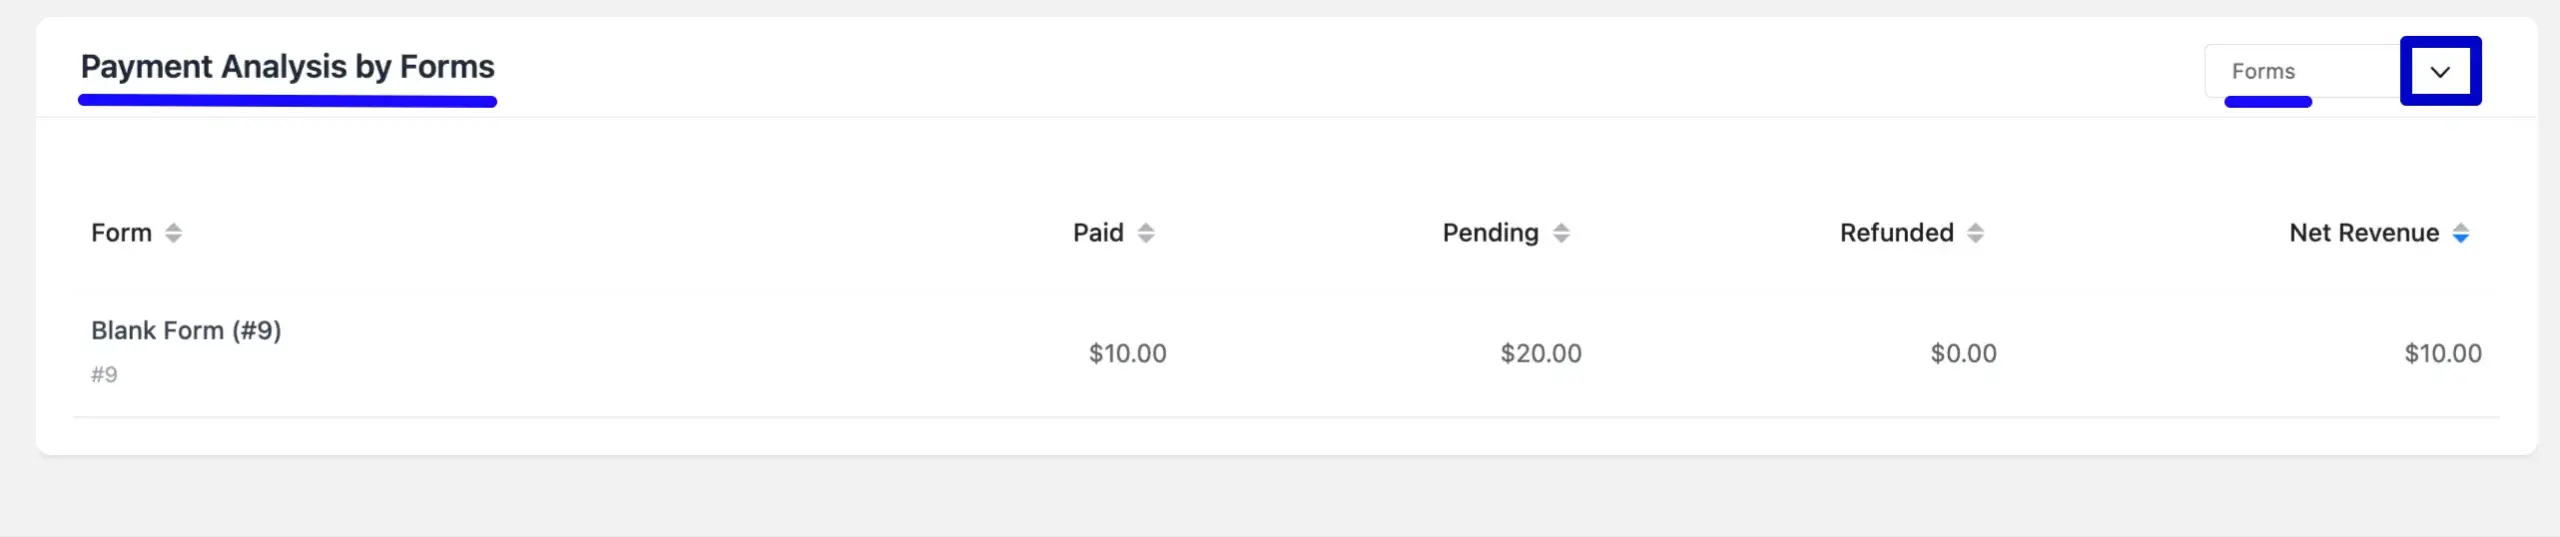
Payment Analysis by Forms: This table breaks down your revenue by individual form. Review the columns to see the Paid, Pending, Refunded, and Net Revenue amounts for each form, helping you identify your most profitable ones.
Use the dropdown in the top-right corner to analyze payments by Payment Method and Payment Type.
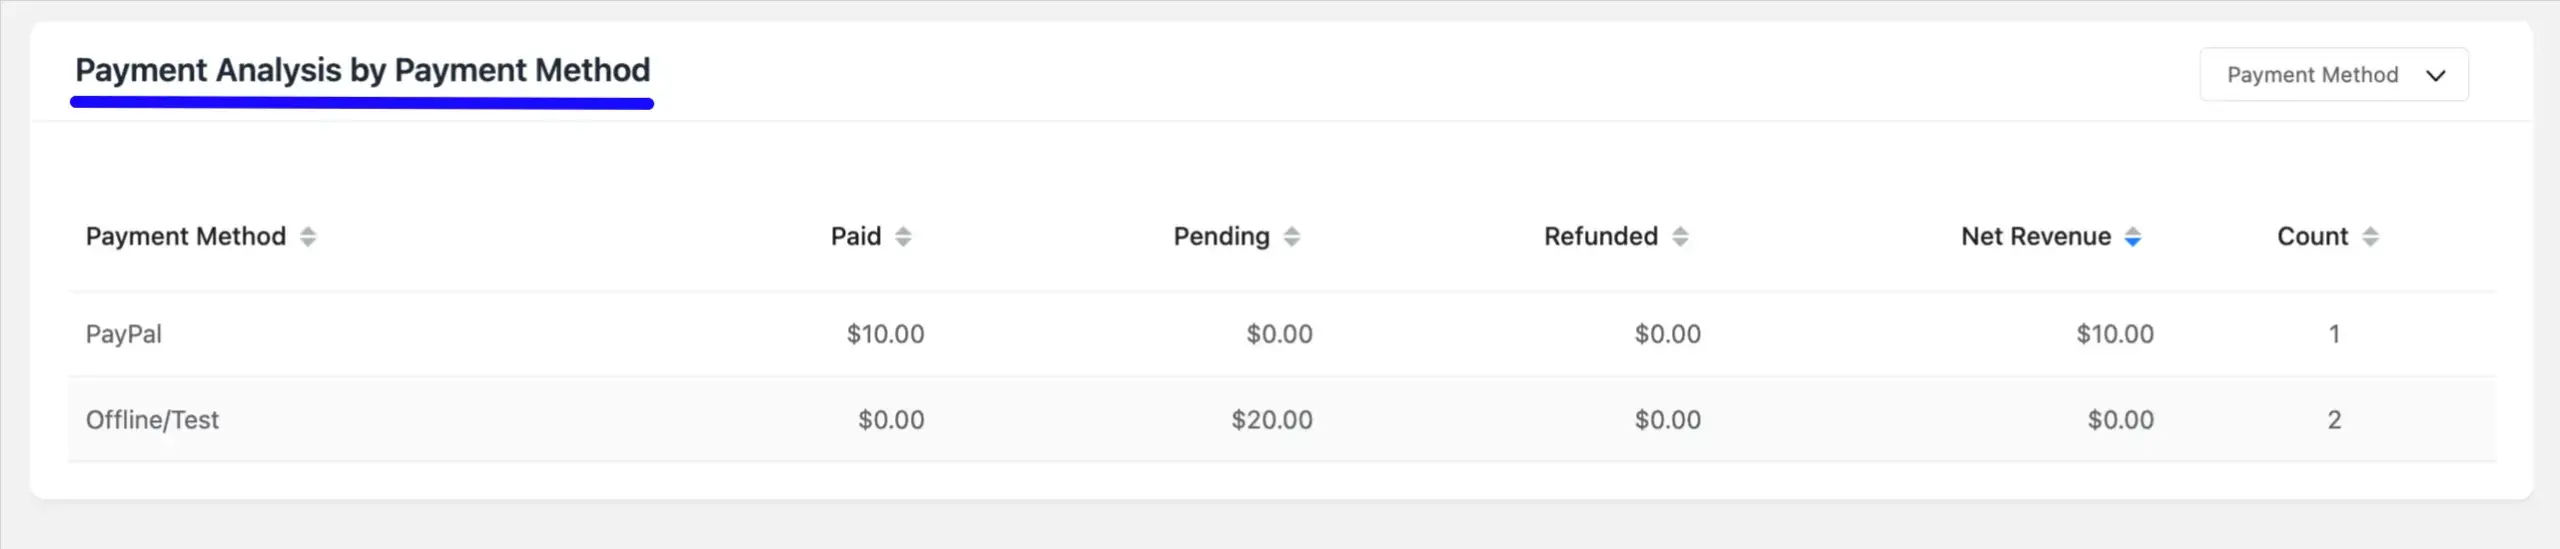
Payment Analysis by Payment Method: Use this table to understand which payment gateways your customers are using. It breaks down all financial data by the specific Payment Method, such as PayPal or Offline/Test.
This allows you to analyze the Paid, Pending, and Net Revenue figures for each payment processor you have enabled. The Count column shows the number of transactions processed by each method.
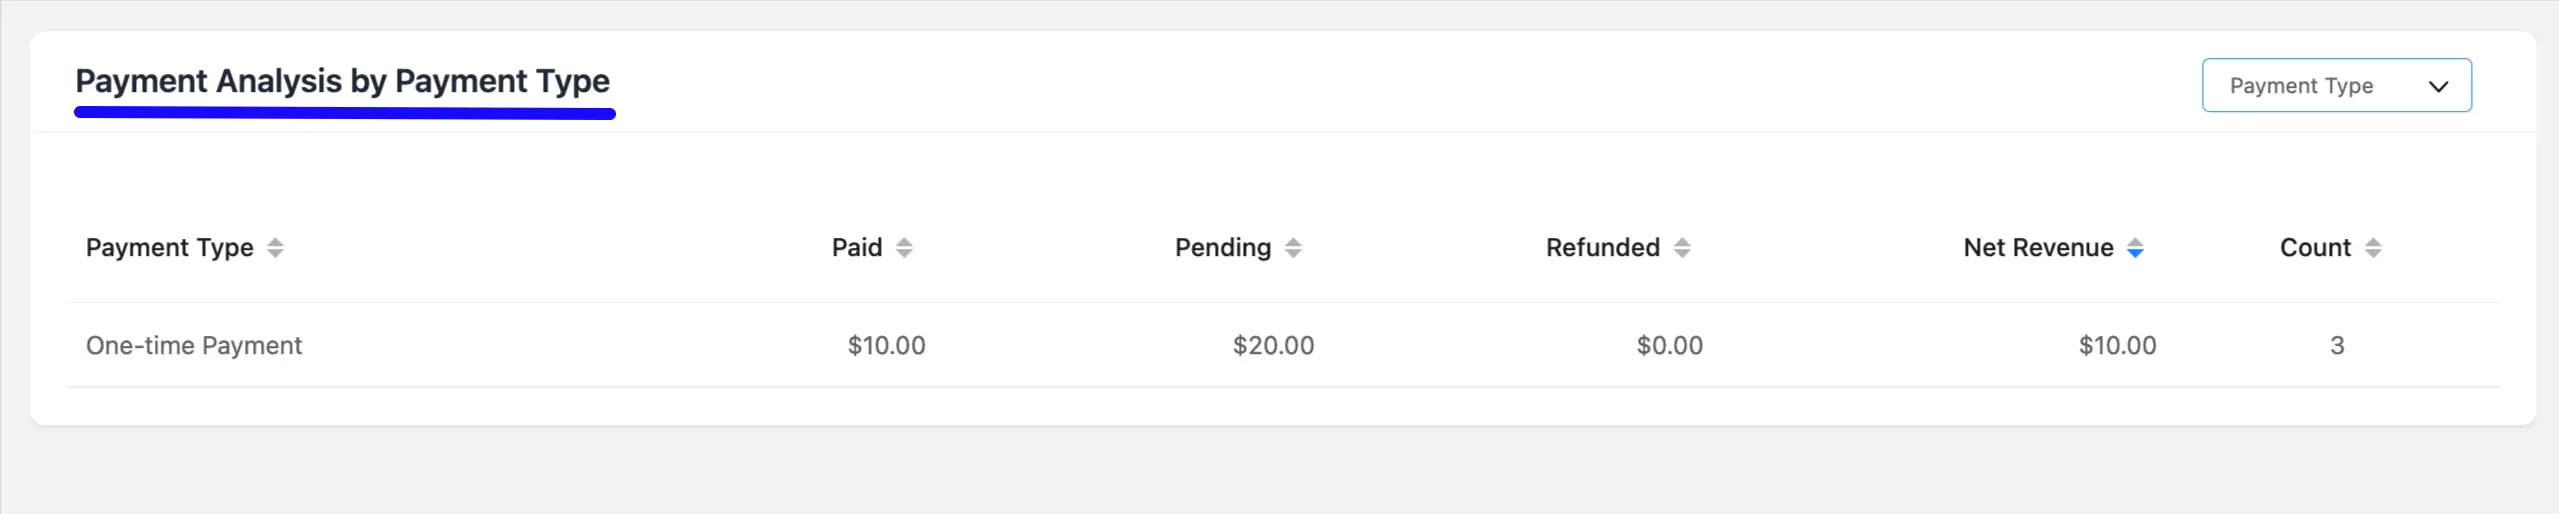
Payment Analysis by Payment Type: This table categorizes your transaction data based on the payment model. You will see a summary of metrics for different types, such as One-time Payment.
The columns show the total Paid, Pending, Refunded, and Net Revenue amounts, along with a Count of total transactions for that type.
This dashboard gives you the financial insights needed to manage and optimize your payment forms effectively.
If you have any further questions, concerns, or suggestions, please do not hesitate to contact our support team. Thank you.


