The Reports dashboard gives you a powerful visual overview of your form submission data and performance. Use these analytics to understand trends, track engagement, and monitor your forms’ effectiveness at a glance.
Accessing the Report Dashboard #
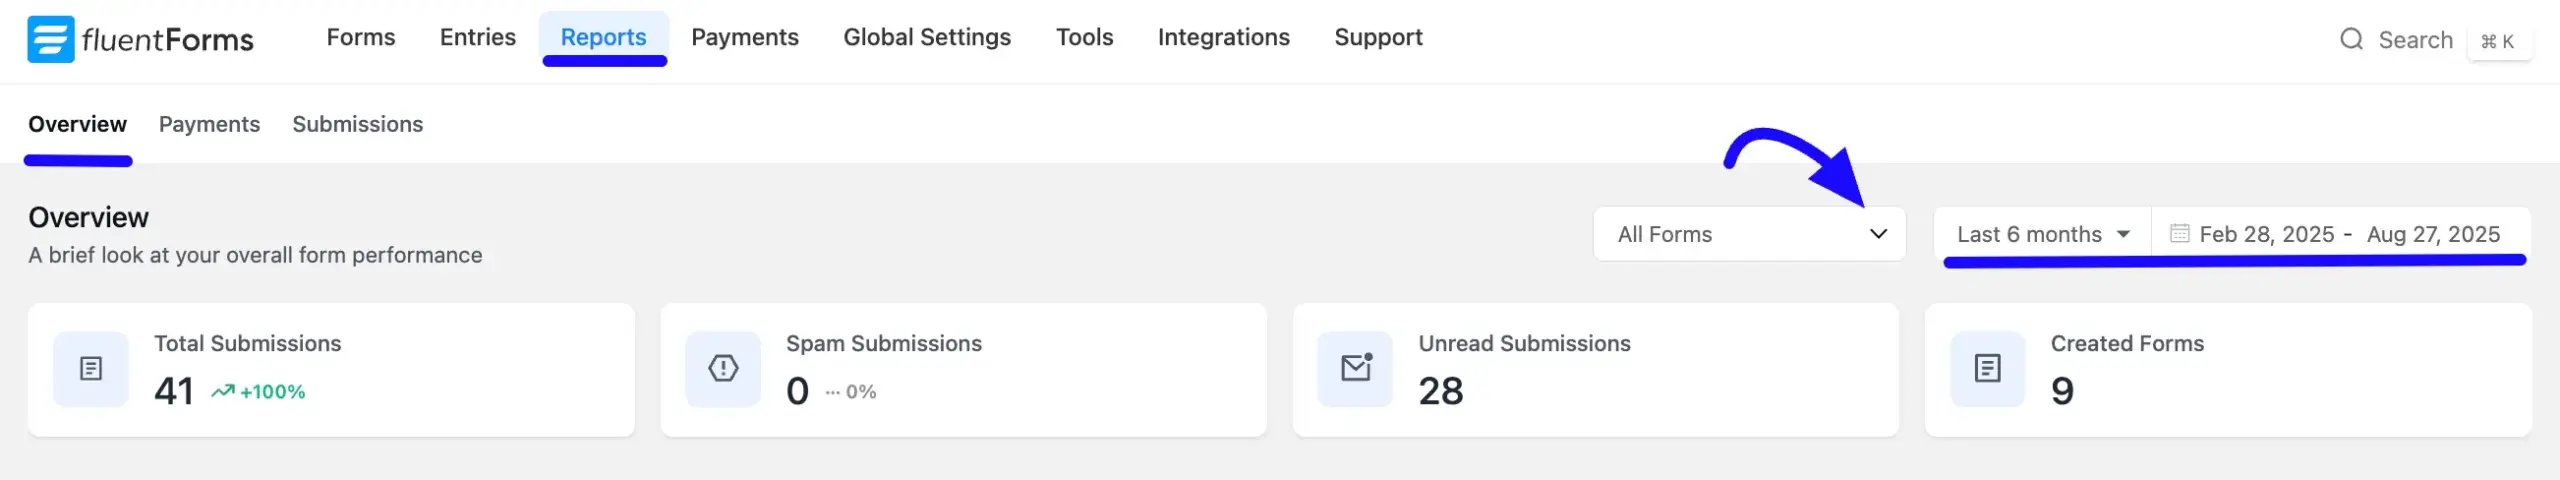
Go to your WordPress dashboard, then navigate to Fluent Forms > Reports in the top menu bar. When you open the Reports section, you’ll automatically be on the Overview tab. This tab is your main summary page.
Filtering Your Report Data #
At the top of the Reports page, you will find global filters to refine the data shown in all charts.
- All Forms: Use this dropdown menu to view data for all of your forms or select a specific one.
- Date Range: Click this filter to select a predefined time period (e.g., Last 6 months) or set a custom date range.
Overview #
The cards at the top of the dashboard provide a quick summary of essential activity.
- Total Submissions: Here, shows the total number of entries received within the selected date range.
- Spam Submissions: Displays the count of form entries flagged as spam.
- Unread Submissions: Lists the number of new entries you have not yet viewed.
- Created Forms: Shows the total number of forms you have created.
Understand Charts and Graphs #
The dashboard contains several visual charts to help you interpret your form data.
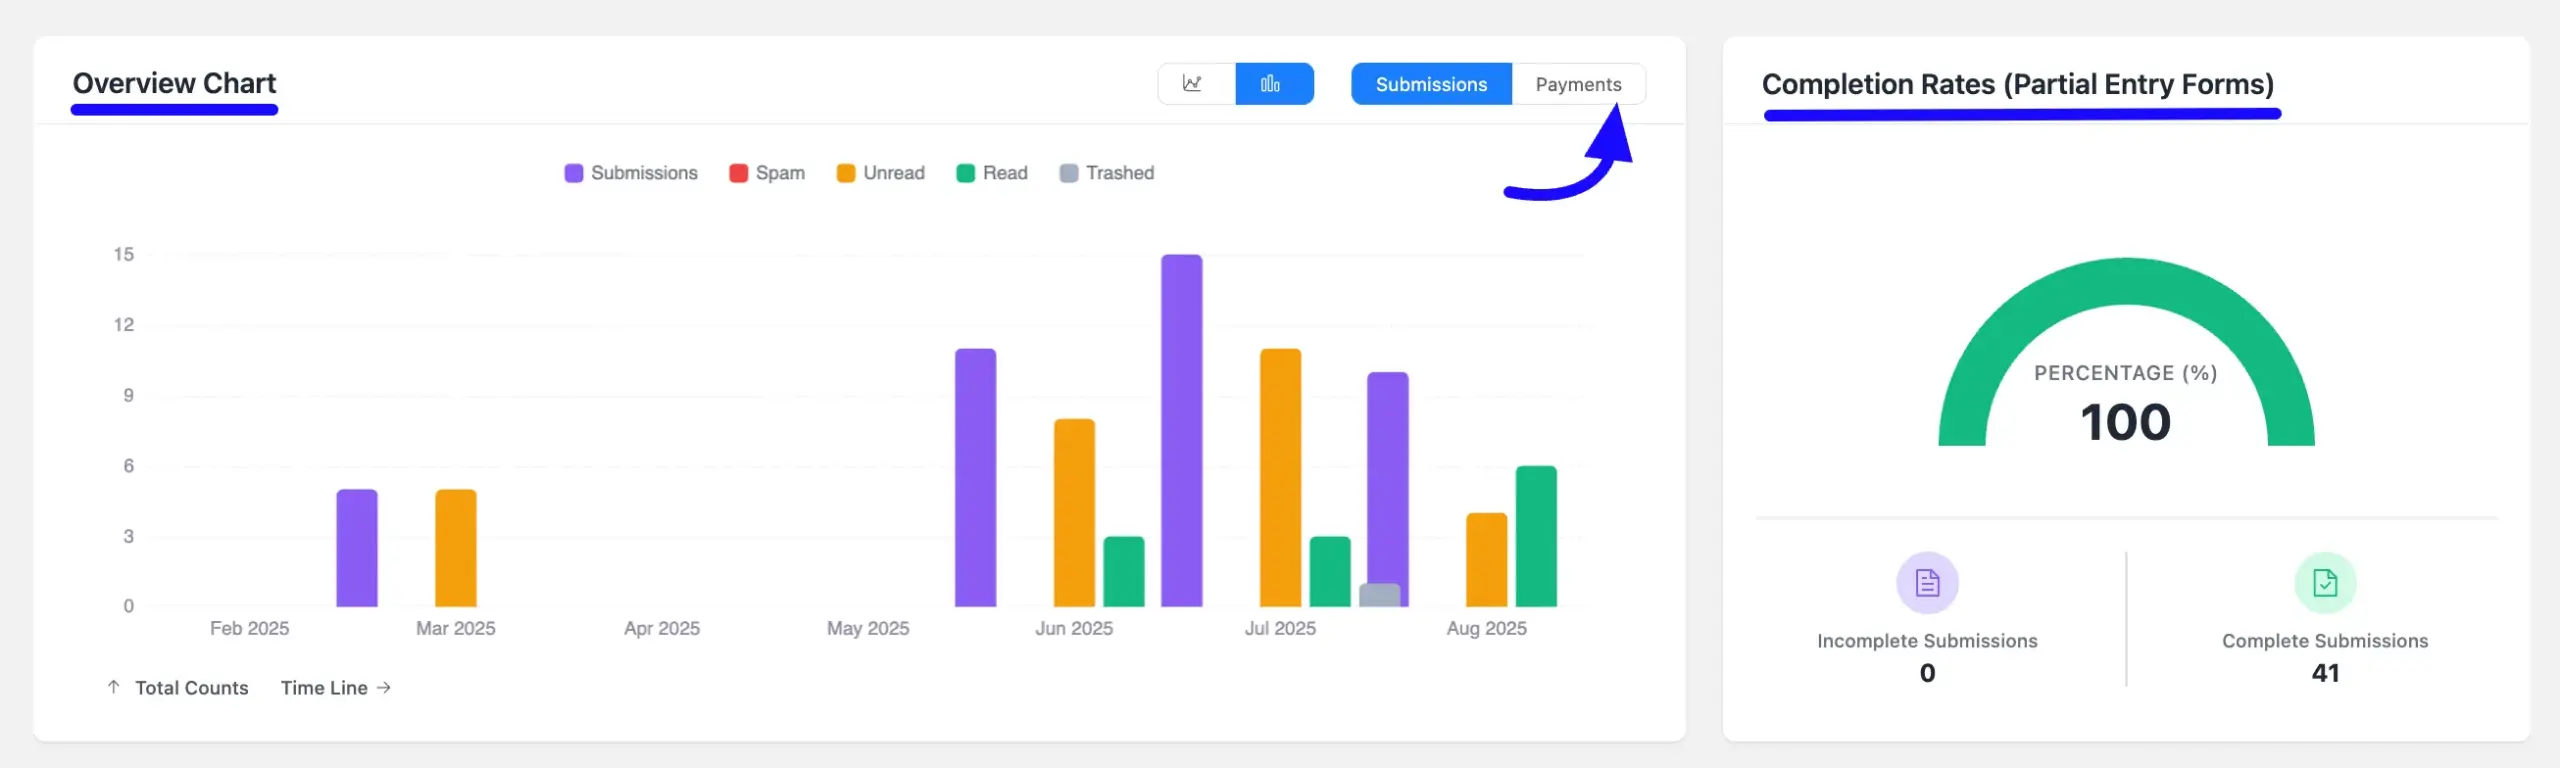
Overview Chart: This bar chart displays submission trends over time. You can toggle the view between Submissions data (including Unread, Read, and Trashed) and Payments data.
Completion Rates (Partial Entry Forms): This chart tracks partial entry submissions, showing the percentage of users who started and completed a form.
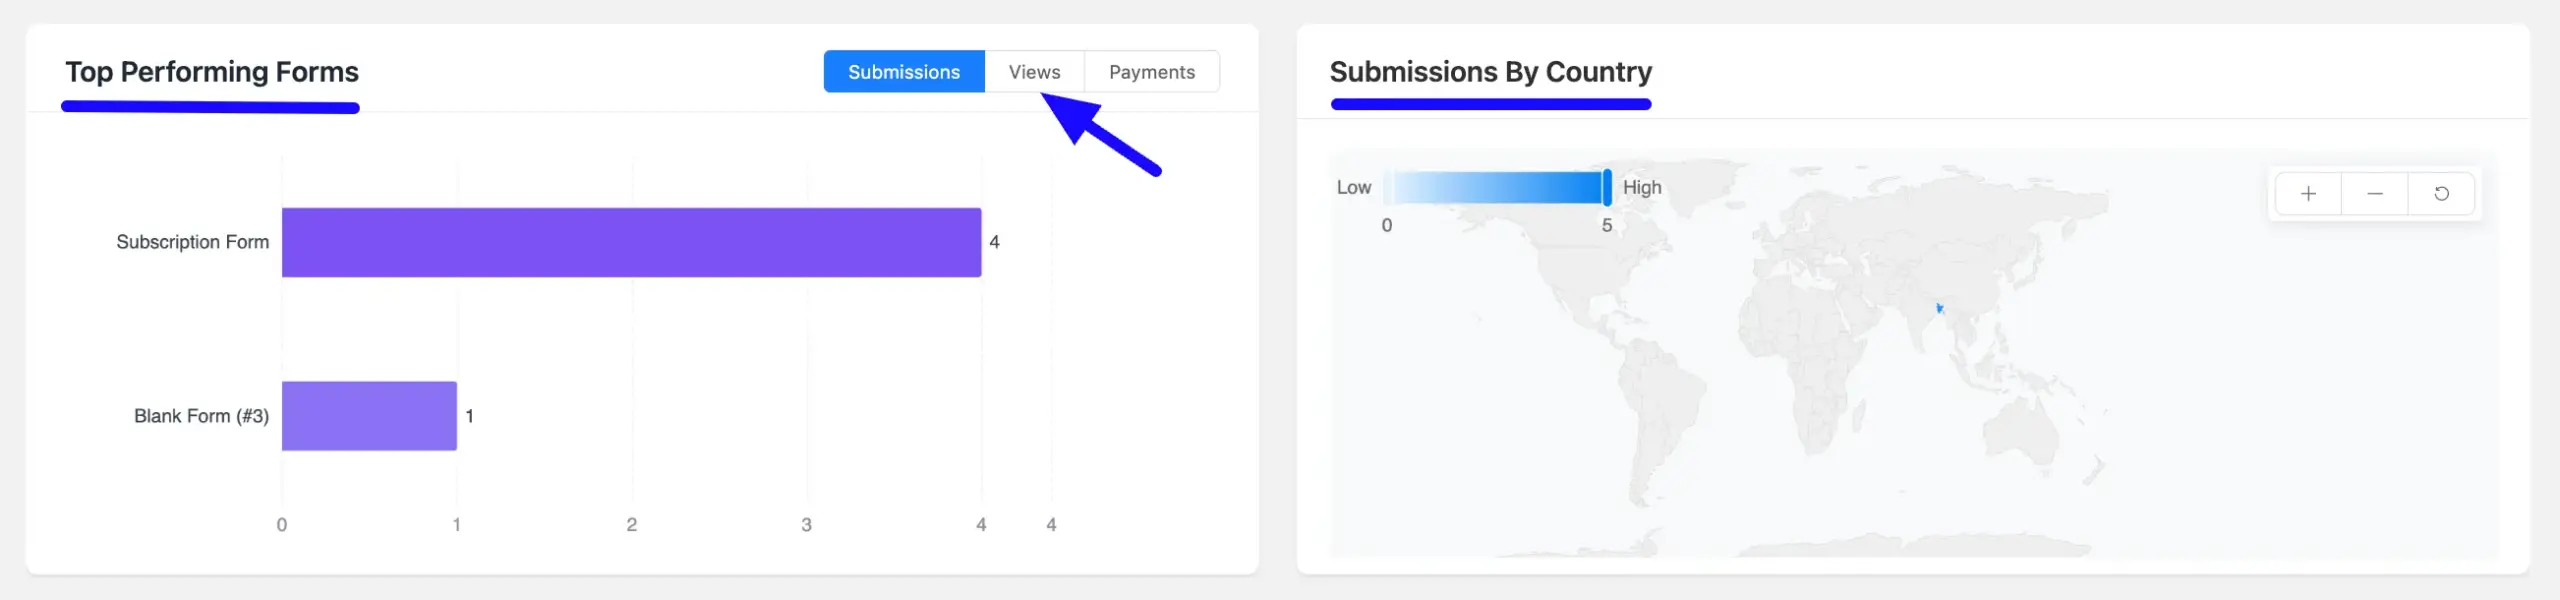
Submissions By Country: This section is designed to visualize the geographic origin of your form submissions on a world map. It helps you understand where your audience is located.
Top Performing Forms: This graph ranks your forms by performance. Use the toggles to view rankings by Submissions, Views, or Payments.
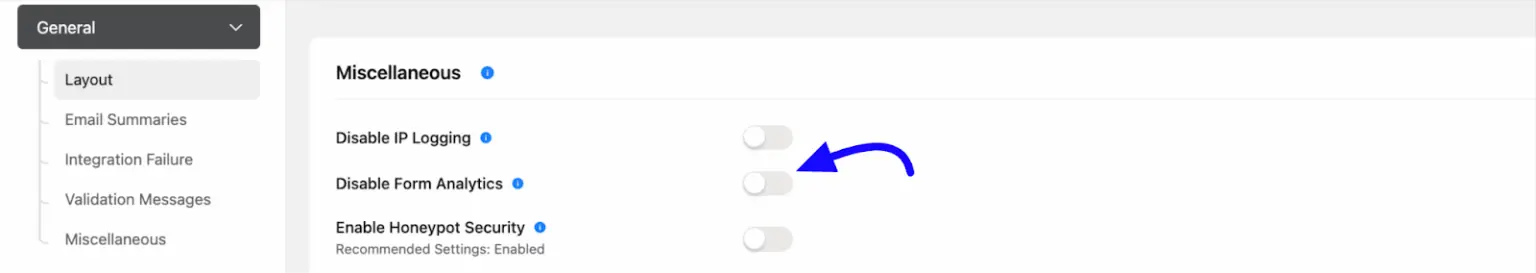
Note: To see Views data, ensure that the ‘Disable Form Analytics’ option is turned off. If this setting is enabled, Views will not appear in your Reports dashboard.
To check this option, go to Fluent Forms → Global Settings → General. Then navigate to the Layout section and scroll down to the Miscellaneous area, where you’ll find the ‘Disable Form Analytics’ option. Simply disable it to start viewing the Views data.
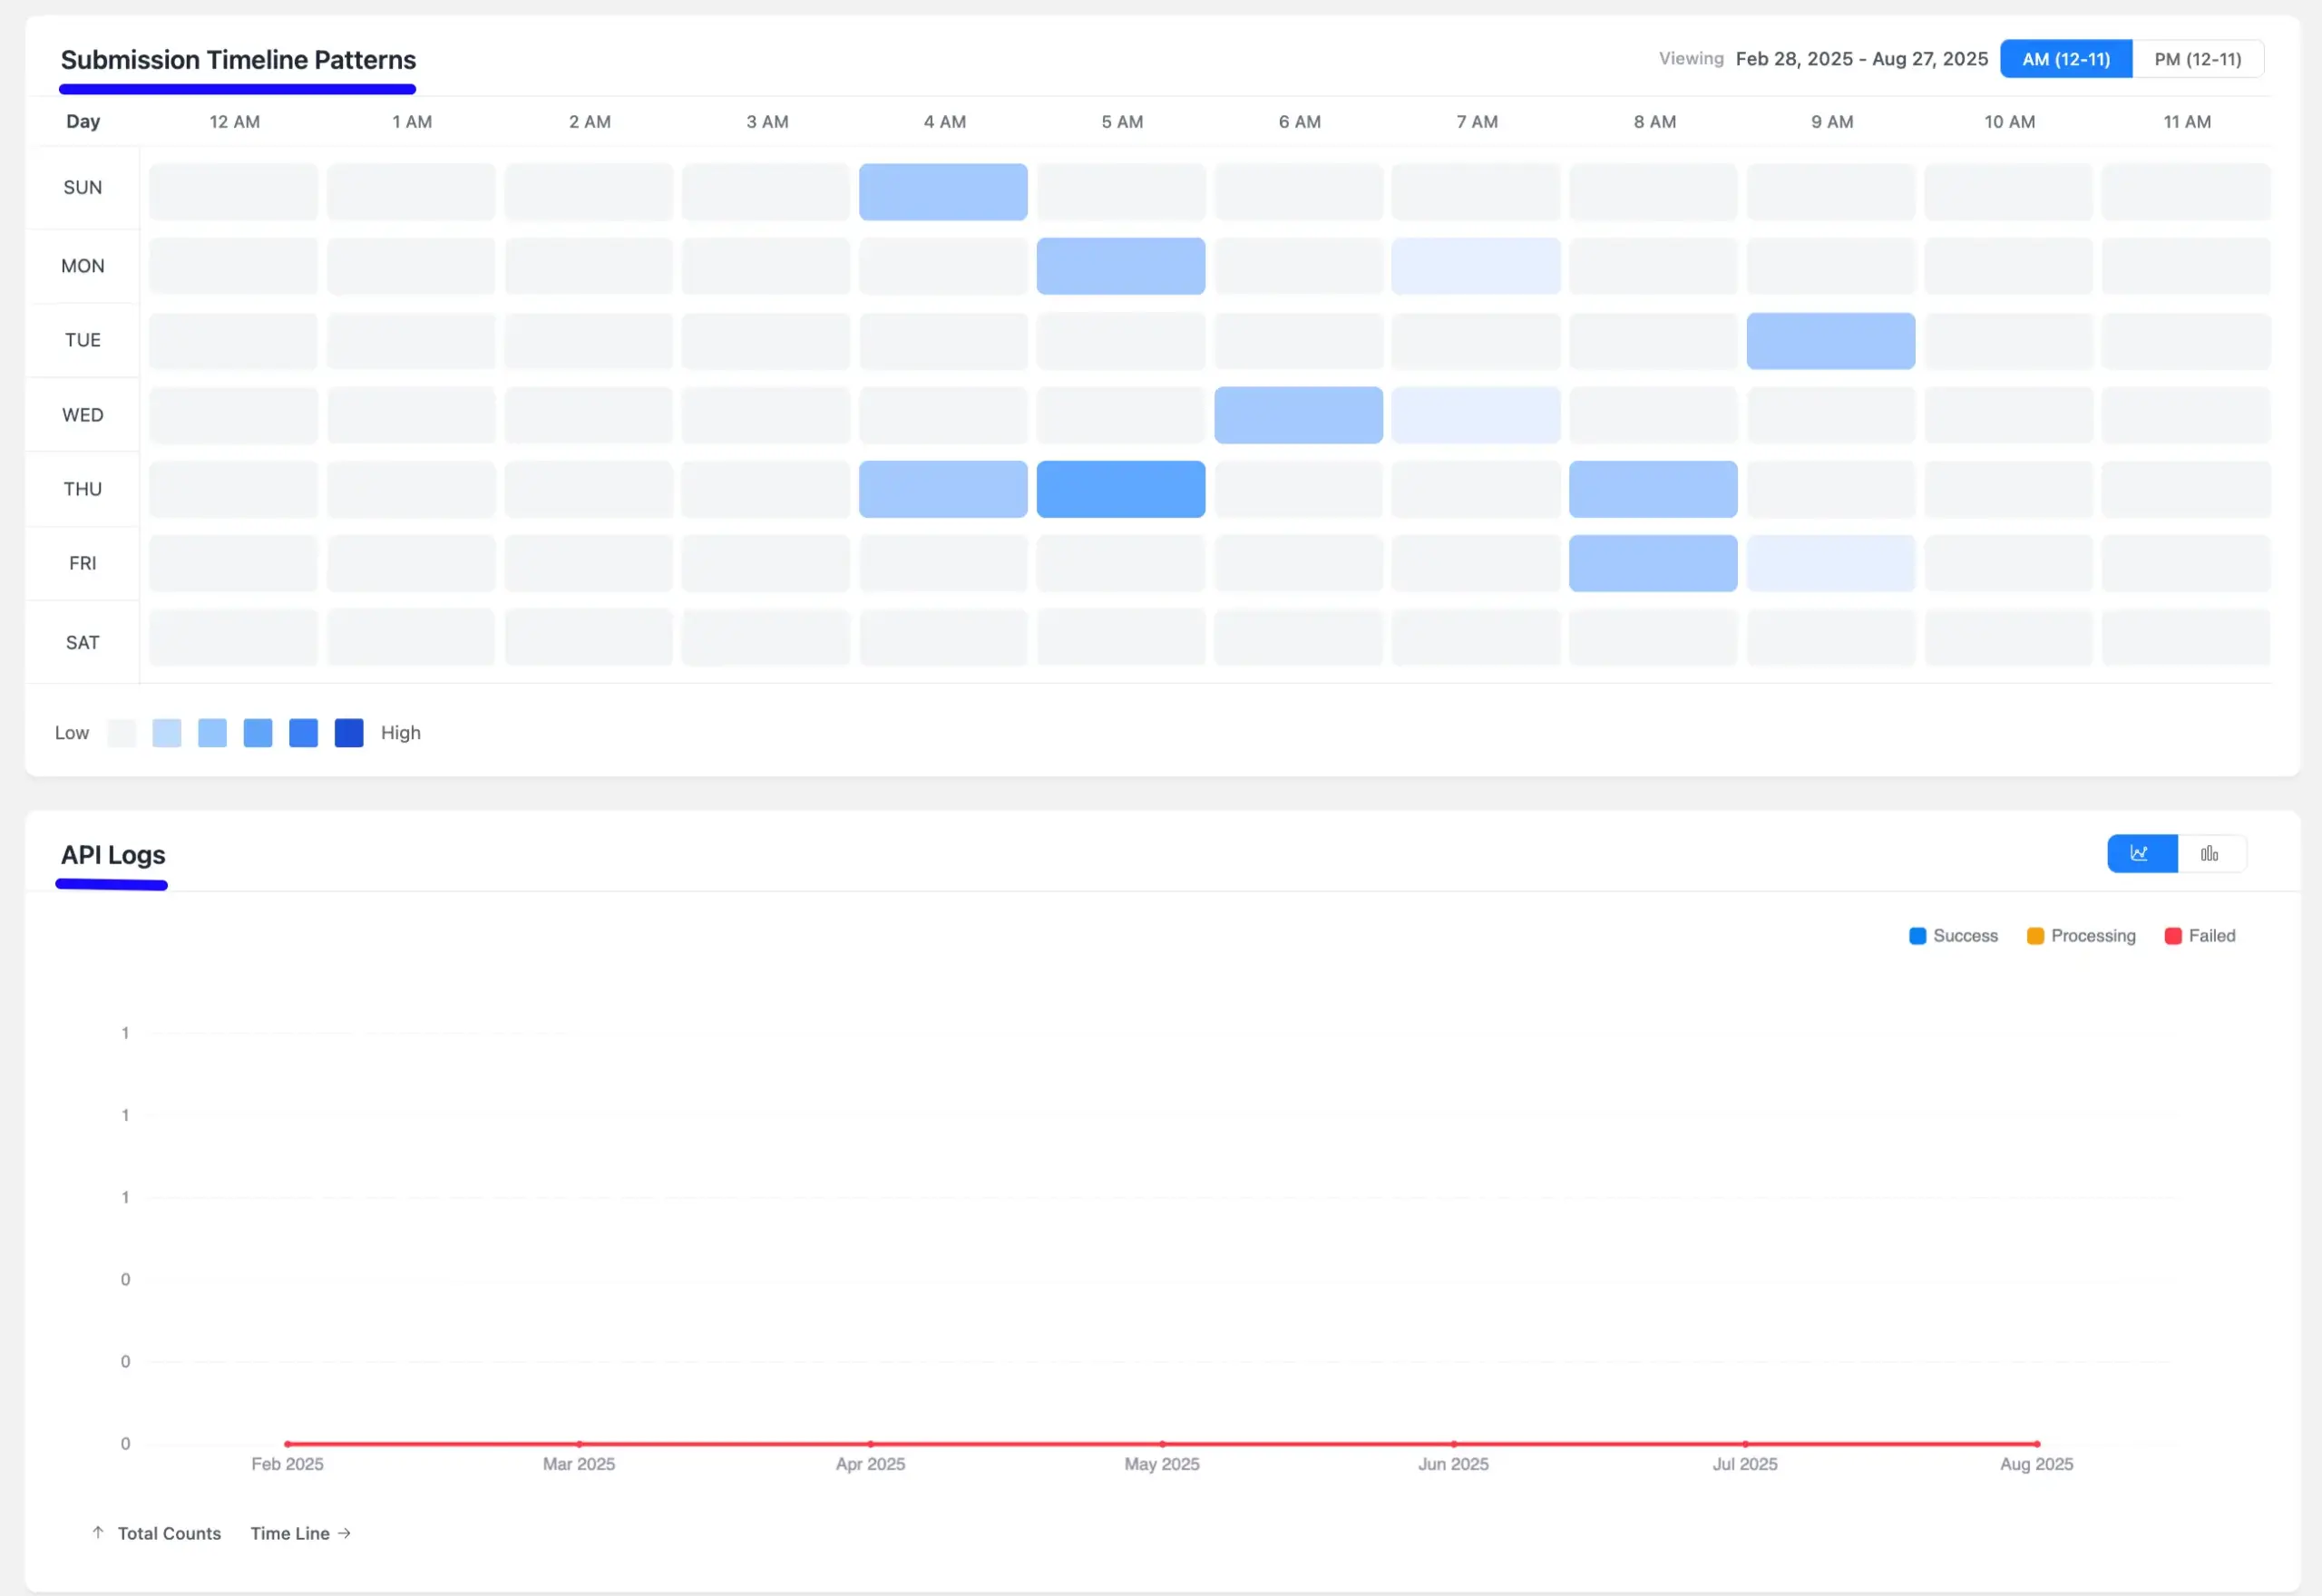
Submission Timeline Patterns: Analyze this heatmap to discover when your audience is most active. Each row represents a day of the week, and each column represents an hour of the day. The color intensity of each block corresponds to the volume of submissions, with darker shades signifying higher activity, as shown in the Low to High legend.
You can use the AM (12-11) or PM (12-11) toggles at the top right to focus on specific time periods.
API Logs: Use this chart to monitor the operational status of your third-party integrations. You can filter the view by status:
- Success: Shows API calls that were completed.
- Processing: Indicates calls that are still pending.
- Failed: Highlights any API calls that encountered an error, allowing you to quickly identify and troubleshoot integration problems.
Understanding these reports allows you to make data-driven decisions to optimize your forms.
If you have any further questions, concerns, or suggestions, please do not hesitate to contact our support team. Thank you.


